
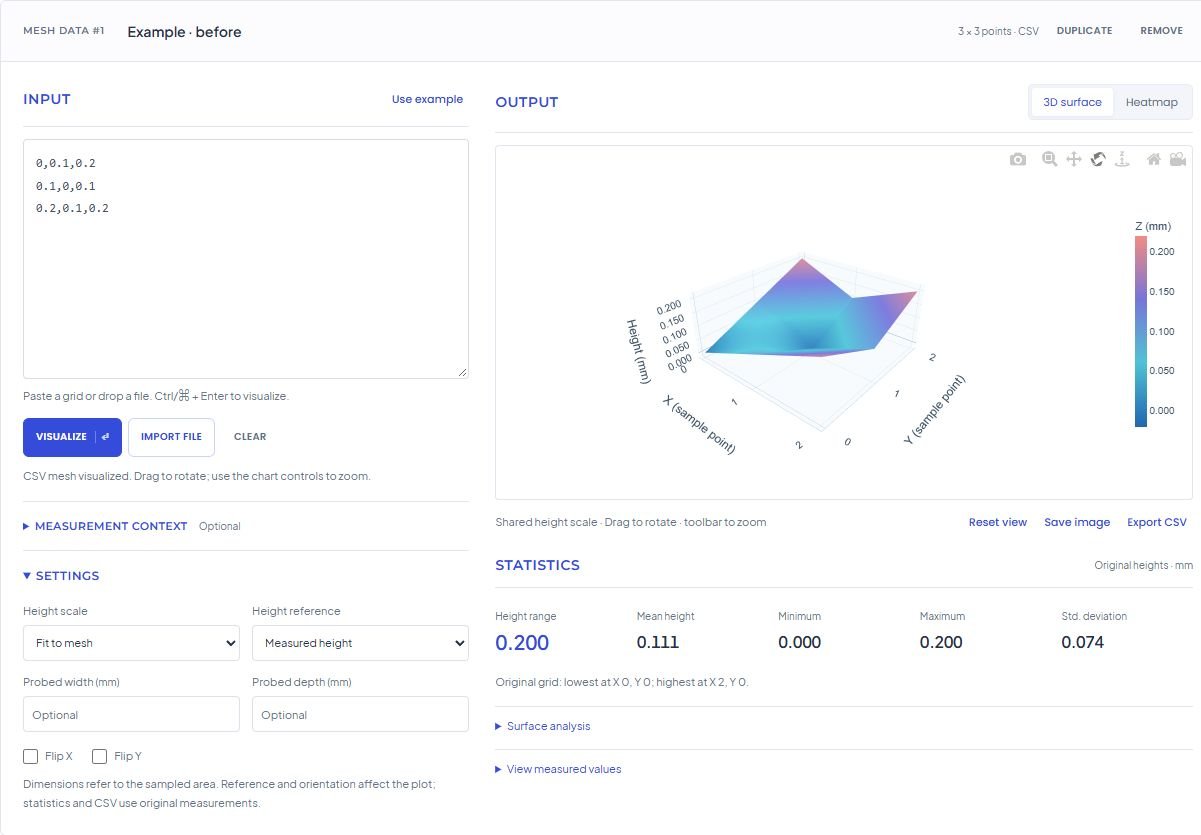
A mesh begins as a small table of numbers. The interesting part is what happens when you can connect those numbers to a position, a shape, and the next measurement. That is the job Bed Mesh is built around.
Keep the measurement close
The visualizer puts input and output beside each other. Paste a supported console grid or import a numeric file, then inspect the 3D surface or heatmap. The measured-values table stays available so that a chart is always traceable back to the original grid.
Statistics and CSV exports use those original heights. Changing the display reference, flipping the view, or removing fitted tilt does not rewrite your measurements. The distinction matters when you return to an earlier run and need to know exactly what was recorded.
Give comparison a consistent frame
A surface fitted tightly to its own range can look dramatic even when its variation is small. Matching chart scales gives two runs a shared frame. Keeping their height references aligned makes the comparison easier to interpret.
There is room for several meshes in one workspace. Each can carry an optional recorded date, bed temperature, build surface, printer setup, and notes. These are your declarations; the tool does not infer them from the grid. Save the workspace as a file to keep the measurements and context together.
The difference heatmap compares matching points directly: after minus before. Its colour scale stays centred on zero, so lower and higher measurements have a consistent meaning. Grid sizes and declared sampled areas must match; Bed Mesh does not silently interpolate one run to fit another.
Stay useful when a chart cannot load
Parsing, measured values, and CSV exports run in the browser. The chart library loads separately. If it cannot be reached, your measurements and their summaries should remain usable. You can also switch to a heatmap when a browser cannot render a 3D surface.
A small tool with a clear job
Bed Mesh does not command your printer or decide which screw to turn. A mesh describes a measurement process, including its limitations. The aim is to make that evidence easier to inspect and compare while leaving the printer-specific decisions with you.
Bring your own grid to the visualizer, or start with the practical guides.