
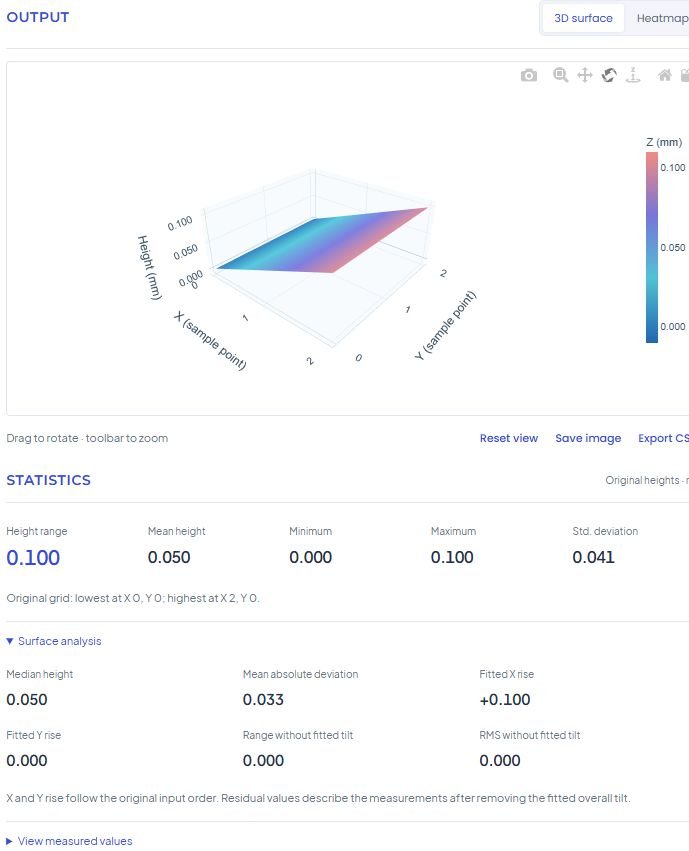
Two meshes can have the same highest and lowest measurements while describing very different surfaces. One may rise steadily from left to right. Another may have high edges and a low centre. Their height ranges alone do not tell those stories apart.
A simple tilted example
Consider this illustrative grid in millimetres. Each column increases by the same amount, and each row is identical:
0.00  0.05  0.10
0.00  0.05  0.10
0.00  0.05  0.10
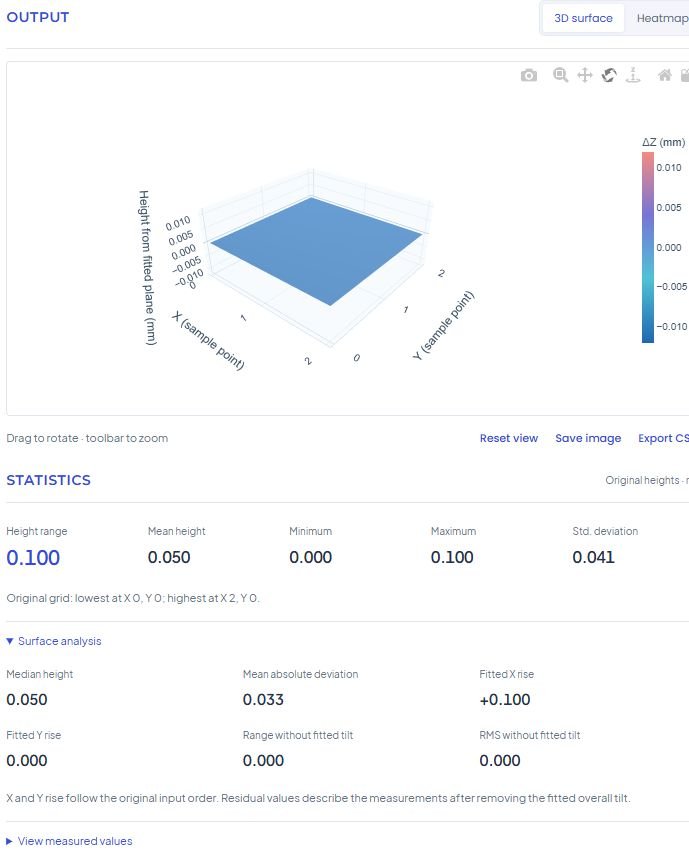
The original height range is 0.10 mm. A plane can describe every point in this example, so subtracting its fitted plane leaves essentially zero residual variation, apart from numerical rounding. The original range still correctly records what was measured.
What the fit measures
Bed Mesh fits a least-squares plane to the regularly spaced grid. The fitted X rise is the plane's change from the first column to the last. The fitted Y rise runs from the first row to the last. These directions follow input order; they do not identify the front, back, or a particular screw on your printer.
Residuals are the measurements after that plane is subtracted. Residual range records their spread, and residual RMS describes their typical magnitude around zero. Curvature or isolated features can remain even when the overall slope has been removed.
Use both descriptions
Read original and residual values together. The original grid preserves the full measured surface. The residual view answers a narrower question: what shape remains once a simple overall tilt has been accounted for?
A fitted plane is a mathematical summary. It does not establish why a slope exists, whether the probe is accurate, or which mechanical change would help. Repeat measurements and knowledge of the printer still matter.
Try Remove fitted tilt in the visualizer's height-reference setting, then return to Measured height. The statistics and exported CSV continue to use the original data in either view.